How to read a compressor map

jackbombay

Top Post Dawg
Joined
Mar 12, 2002
Location
Diesel knows best
TDI
A4 Jetta
Does anyone have a link handy that runs through the basics of reading a compressor map? I'm also looking for the map for the popular PD 150 turbo. Lastly how would one factor in high altitude (6,300 ft) when trying to determine at which point surge would occur on any given map?

TIA
 

TDIMeister

Phd of TDIClub Enthusiast, Moderator at Large
Joined
May 1, 1999
Location
Canada
TDI
TDI
Part 1: Introduction

I’m sorry for being delayed in responding to this, although I had always intended to address this question. Unfortunately, I have not taken the time to search the Internet for a good and succinct tutorial on reading compressor maps, but I’m sure searching on Google will get you the same results as I would... so here is my “short” spiel about it. :) Because of the length of this, I will split this into a couple of separate posts, beginning with
1. Introduction and a brief note about the specific turbo being discussed
2. Important definitions for reading a compressor map
3. Plotting operating points between engine volumetric capacity and the turbocharger (the fundamental aspect of turbo matching), as well as further reading references.

First of all, I will use as a subject, a turbocharger that is one of the most hotly discussed for TDIs at the moment: the VNT-20, a.k.a. GT2052V or GT2252V. It should be noted that there are many, many variations of turbochargers within each Garrett product family. When you ask for a VNT-20 or GT2052V or GT2252V, you’re not just asking for one specific turbocharger, but rather there could be dozens of options to choose from among various OEM sources (there are no known aftermarket sources for VNTs per Garrett policy):
http://turbomaster.info/eng/catalogs/model.php?base=garrett&pagina=GT20V
http://turbomaster.info/eng/catalogs/model.php?base=garrett&pagina=GT22V

For now, however, the compressor map I’m using comes from a VW-authored paper on the 1997 R-TDI. It is a VNT-20 model, but the exact VW part number or original fitment of this turbocharger is uncertain. However, based on the 1997 date of the paper, and the shape of the compressor outlet of the VNT-20 unit available in VAG models at the time compared to that installed on the 1997 R-TDI, it is reasonable to deduce that this turbocharger is the same as or close to that installed in the top-rated 5-cylinder TDI engine of the period, that is, 074 145 703E pictured below and NOT 059 145 701E/-F/-G installed into the V6 TDI nor 145 703D installed in the LT II. See pictures below to illustrate compressor outlet differences.


VNT-20 turbocharger installed on the VAG V6 TDI and LT II. Note the direction of the compressor outlet is parallel to the inlet.


VNT-20 turbocharger installed on the VAG 150HP 2.5 5-cylinder TDI (AXG/AHY; 074 145 703E).


Rear view shot of the R-TDI engine. Note the compressor outlet direction perpendicular to the inlet and apparently simply clocked differently to the stock AXG turbo…


With that out of the way, on to the map:


It should be first noted that maps are also NOT generic within a turbo family but rather are specific to parameters such trim, A/R ratio, exducer diameter, blade count, etc., and OEMs can vary these options in order to get the optimum match to their respective engines. Therefore, using THIS map can be different from the map of another VNT-20, even from the same car manufacturer! Use this map ONLY as a reference and rough guess! In future, if there is interest, I might give a short explanation of these parameters and their effects, but your best resource is to refer to the books I list at the very end.

Everything discussed here onwards will reference to what is known about the R-TDI turbo and the T4 Transporter OEM version (074 145 703E).
 
Last edited:

TDIMeister

Phd of TDIClub Enthusiast, Moderator at Large
Joined
May 1, 1999
Location
Canada
TDI
TDI
Part 2: Definitions and Terms

First of all, a few definitions and boundaries of the compressor map graph are in order.


The X-axis on the graph is corrected air flow in pounds per minute (lb/min, LBM, etc.), which you can obviously read. What is important to recognise is that this is a MASS flow rate, NOT a VOLUME flow rate (e.g. measured in CFM) which you may encounter in some other maps from different manufacturers. This distinction is vitally important, and although I won’t get into why, it suffices to say that a MASS flow rate is the ONLY useful parameter for your purposes. The term “corrected” basically corrects the inlet conditions with standardized reference conditions from which the maps are derived. There might also be consideration of the conversion between stagnation (total) pressure and static pressure (what you would read in a gauge) across the compressor, as well as inlet temperature. Most turbo manufacturers will state the reference ambient conditions if you know where to look for it, but it is usually 25°C (298K) and 100 kPa. For your purposes, you don’t need to care about this further, except to reiterate that corrected MASS flow rate is important.

The Y-axis denotes the pressure ratio (PR), that is, the ratio of the pressure at the outlet and inlet of the compressor. Again, in more detailed maps, there maybe a footnote if the PR being illustrated is “total-to-total,” “total-to-static,” or “static-to-static,” etc. In most cases the difference between them are relatively small, and if not otherwise specified, you can assume, as in this case, static-to-static, which is more useful and intuitive since that’s what you measure with a gauge. Most people will go even further to simplify, treating PR as simply the absolute boost pressure in bars. This is not exactly correct, because there are pressure losses both at the inlet and outlet of the compressor at either point of measurement (i.e. some distance up- and downstream of the compressor itself, taking into consideration pressure losses in the air box, plumbing, intercooler, etc.), and dynamic and temperature effects. For example, if you are running at a boost pressure of 2 bars absolute, you can expect the actual compressor PR to be somewhat higher than 2. This is fine as an estimation, but just be aware of the distinction.

Now, with that out of the way, we look to the actual map curves themselves. The left-most boundary of the map is called the surge region. Surge is a not-well understood phenomenon, even by researchers in the field of turbomachinery – how much more murky it is then, for laypeople! This would be a whole other long missive, which I won’t get into. As far as you and I are concerned, it suffices that you would want to avoid operating in surge as much as possible.

The right-most boundary of the map is called the choke region. This is a bit more intuitive, as there is a maximum amount of a fluid you can pass though a hole of a given size before the flow becomes sonic and you can’t (normally) flow any more. Note here that the lines of constant RPM (the set of curves that start almost perfectly horizontal on the left side of the map, labelled 120000, 140000, 160000, etc.), drop off quite steeply near the choke region. The physical explanation of this is that as the compressor approaches choking flow, the RPM increases rapidly, as does the PR, but the mass flow doesn’t follow proportionately. A more simplified analogy: if you blow through a thin straw, at a certain point you can blow as hard as you can, but you won’t get appreciable more mass flow of air.

Next you note a bunch of teardrop-shaped loops and truncated curves going in the direction up and to the right with labels 76%, 75%, 70% and 65%. These are your efficiencies; the closed loops are what are colloquially called “efficiency islands.” The apparently open curves are actually just truncated loops outside of the normal operating range of the turbocharger.
 
Last edited:

TDIMeister

Phd of TDIClub Enthusiast, Moderator at Large
Joined
May 1, 1999
Location
Canada
TDI
TDI
Part 3: Turbo Matching Basics

Now, knowing what you are reading in the map in front of you, the heart of turbo matching involves, quite simply, matching what the engine is capable of taking in, and what the turbo is able to supply, throughout their respective operating ranges.

All you’re doing is plotting points of (boost) pressure versus mass flow rate of the engine (which, among other things, are dependent on engine RPM; engine geometry – bore, stroke, cylinder count, and in more detail, piston speed, L/R ratio, etc.; and volumetric efficiency, which are affected by valve size, timing, lift, port/manifold cross-section, length, design, etc.). Note that this has nothing to do with the turbocharger; here we’re only concentrating on the engine, and if we add a turbocharger, it does not materially affect the volumetric efficiency of the engine, which is defined as:

Volumetric efficiency -- The percentage mass of air that is actually trapped in the cylinders divided by the mass of air that would be theoretically be able to be trapped for the given swept volume of the cylinders at the same prevailing conditions.
The part that I highlighted in bold shows the importance that we’re dealing with a MASS flow, not a VOLUME flow (as discussed in my previous post about turbocharger flow rates), while the italicized part focuses on the fact that volumetric efficiency is a function of the natural breathing capability of the engine (i.e. RPM, geometric and design parameters of the engine), and is NOT significantly affected by externalities like the addition of a turbocharger. That means, for the purposes of calculation, the volumetric efficiency value of the engine DOES NOT CHANGE even if you have 3 bars of boost compared to simply atmospheric!

From here, I have found a very useful online turbo calculator here:
http://www.not2fast.com/turbo/glossary/turbo_calc.shtml

Below is a screenshot of parameters I inputted into the calculator a TDI engine running 2.87 bars of boost:


Here, I had the benefit of extensive test data and information for the R-TDI engine:


And just to repeat for review's sake:


Thanks to the above information, for example, I am able to determine manifold boost pressure (2.87 bar – 27.5 PSI), compressor outlet temperature (191*C), post-intercooler temperature (49*C), and play around with compressor efficiency (65%), intercooler efficiency (83%) and IC pressure drop (1.5 PSI) to get numbers that 1) agree with the test data first and foremost; 2) agree reasonably with the compressor map; and 3) are REASONABLE and REALISTIC values!

Without all this information, I can only use intuition to arrive at a set of REASONABLE and REALISTIC initial values for compressor efficiency, intercooler efficiency, IC pressure drop, and volumetric efficiency. Then I superimpose the initially-calculated pressure ratio – labelled (3) in the turbo calculator worksheet – and LBM air flow (4) onto the compressor map; interpolate the compressor efficiency and iteratively recalculate values on the worksheet until I come to an acceptable convergence with final values.

Note: In the worksheet, ignore the fields for Air:Fuel Ratio and the results for HP, Torque, BMEP and Injector sizing, as they are not at all applicable to Diesel engines!

After all is said and done, I arrived at a mass flow rate at maximum power conditions (27.5 PSI of boost @ 4000 RPM) of 22.37 lb/min, which agrees well with the R-TDI VNT-20 turbo map above (make it an exercise for yourselves to identify the operating point on the map at maximum power).

And here is where I want to make a little plug about something I have been arguing about for years: Even when the R-TDI in this paper is operating at full power and max. boost (190HP @ 4000 RPM @ 27.5 PSI boost), the mass flow, whether you choose my numbers or the numbers in the VW map, is around 22-23 lb/min (10kg/min).

I have debated about the use of massively-sized turbos which can flow many times that capacity. I have explained that volumetric efficiency by definition is independent of boost pressure, and that it is instead a function of engine geometry and design, and has nothing to do with the turbocharger.

That said, the 1.9L R-TDI engine utilizes almost ALL of the useful operating range of the VNT-20 turbo in this example, from right at the ragged edge of surge, until choking and overspeeding @ >180000 RPM.

Sure, there is much to be gained by an even larger turbo than the VNT-20 to move the choke threshold to the right, but in so doing, the WHOLE map moves to the right, including the surge line. It is wishful thinking that you can have a big turbo and not have to worry about surge in the low-end!

All this work was for just one operating point. You will then do the same process for different RPMs at max. boost to get full-load values (but remember that all of the values like compressor/intercooler efficiencies, pressure drop, volumetric efficiency, etc. will NOT remain constant) and you may also choose to calculate part-load scenarios as well.

Lastly, here is a very small listing of book titles I have read that would be good references to learn more about this subject:
- Watson & Janota: Turbocharging the Internal Combustion Engine
- McInnes: Turbochargers
- Challen & Baranescu: Diesel Engine Handbook
- Heywood: Internal Combustion Engine Fundamentals


Damn, I can’t believe I have spent more than 4 hours on this!!!
 
Last edited:

jackbombay

Top Post Dawg
Joined
Mar 12, 2002
Location
Diesel knows best
TDI
A4 Jetta
TDIMeister said:
I’m sorry for being delayed in responding to this, although I had always intended to address this question.
I'd had my fingers crossed that you'd respond to this thread, thanks for taking the time to put it together!

TDIMeister said:
When you ask for a VNT-20 or GT2052V or GT2252V, you’re not just asking for one specific turbocharger, but rather there could be dozens of options to choose from among various OEM sources (there are no known aftermarket sources for VNTs per Garrett policy):
http://turbomaster.info/eng/catalogs...t&pagina=GT20V
http://turbomaster.info/eng/catalogs...t&pagina=GT22V

For now, however, the compressor map I’m using comes from a VW-authored paper on the 1997 R-TDI.


The links don't work for me, I did go straight to the turbo master web-site but can only find listings for the GT series turbos :confused:

I get the impression that compressor maps for specific turbos are hard to come by, does anyone have the map for the VNT 1749vb kicking around? Or is that somewhat "classified" information? I really want one now seeing as I will actually be able to use it.
 

TDIMeister

Phd of TDIClub Enthusiast, Moderator at Large
Joined
May 1, 1999
Location
Canada
TDI
TDI
Sorry, I do not have a map specifically for the GT1749VB used in the PD150. Yes, maps are exceptionally hard to come by for the public, especially for VNTs, unless you're lucky and/or you find some through SAE papers.

The links seem to work for me, but maybe you misunderstood what I intended to show with the links: that there are TONS of turbos within each turbo family (e.g. GT20V and GT17V) from various OEMs. That's all I intended to illustrate from those links.
 

TDIMeister

Phd of TDIClub Enthusiast, Moderator at Large
Joined
May 1, 1999
Location
Canada
TDI
TDI
If anyone has access to maps for Holset turbos, I would greatly appreciate to look at them. I will do an analysis of a good 2-stage match and share what I find. I have a very poorly scanned and marked-up map of an HY35_VG30ET turbo but would like proper ones; it's barely legible.
 

dvst8r

Veteran Member
Joined
Dec 6, 2004
Location
Airdrie, AB
TDI
'03 Wagon
It is a Holset Hy-35, with a Nissan vg30et engine ploted over it ;). Just as not to confuse people with a possible long part number or somthing.
 

TDIMeister

Phd of TDIClub Enthusiast, Moderator at Large
Joined
May 1, 1999
Location
Canada
TDI
TDI
Good, you know what I'm taking about then. ;) Do you know where I can get access to more maps? :)

Thanks!
 

dvst8r

Veteran Member
Joined
Dec 6, 2004
Location
Airdrie, AB
TDI
'03 Wagon
I have been working at getting good holset maps, for the better part of two years, I have a holset hx-30W map, but no numbers along the axis. I took a picture of the map and the flash on the camera inadvertenly whited them out. I think I may have a new source soon though.

The funny thing is I was in @ PDR last fall, and Mark from PDR had a big desk pad that was a holset hx-35w overlayed with a pdr-hx35 and overlayed with an hx-40w and again with a pdr hx-40. I never even thought to ask for a copy of it or to take a picture of it ect...:eek:
 

TDIMeister

Phd of TDIClub Enthusiast, Moderator at Large
Joined
May 1, 1999
Location
Canada
TDI
TDI
Yep, that's a very, very good map for a 1.9 TDI ;) The top-end of the engine would see the turbo operating at a efficiency of 72% at a PR of 3 vs. 65% of the 1997 R-TDI. The higher efficiency would result in less charge heating and less exhaust backpressure.

This compressor can very easily be mated to a VNT hot-side. No reason why it has to remain a WG unit. :)
 

TDIMeister

Phd of TDIClub Enthusiast, Moderator at Large
Joined
May 1, 1999
Location
Canada
TDI
TDI
Referring to my original analysis of the R-TDI engine above, I have done some further calibration and refining of data for the Turbo Calculator applet. I have found excellent agreement between the published data and that calculated at the rated power point.

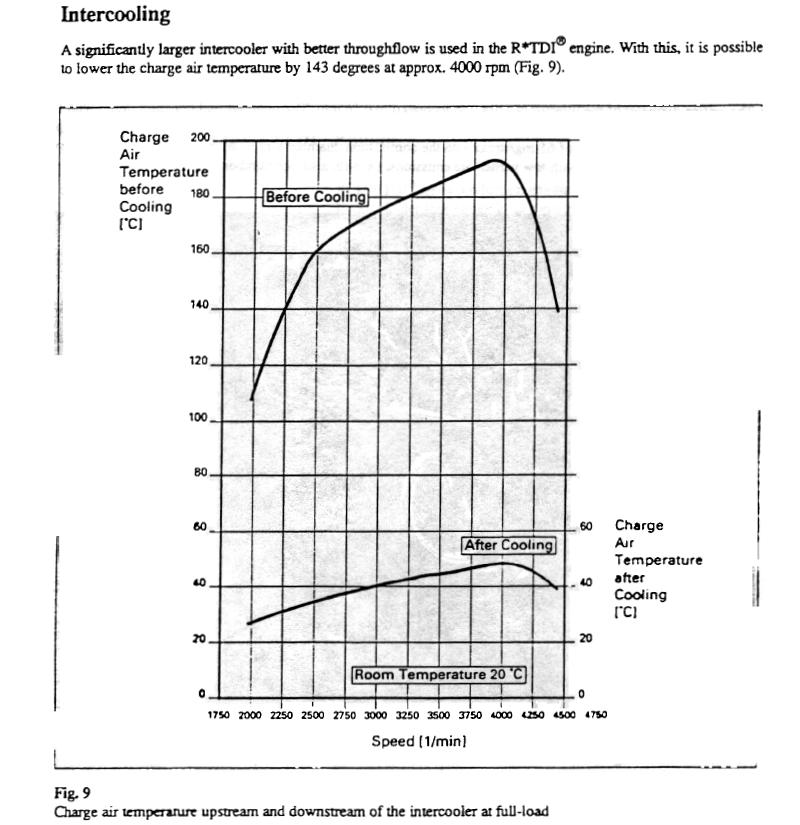
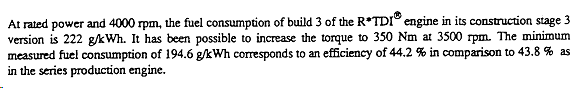
Key to making the calculation fit the published data was determining the correct BSFC at the operating point of interest. This was given in the paper:


A BSFC value of 222 g/kWh equates to about 0.365 lb/HP/hr (222*2.204*0.746/1000).

I also assumed a full-load air-fuel ratio at rated power of 19:1, which equates to a Lambda value of 1.3. This value is determined from experience and is a reasonable assumption.

The calculations and assumptions for the BSFC and AFR are valid in this Turbo Calculation applet, because the heating value of Diesel fuel per unit of mass is almost identical to that of gasoline (between about 42-43 MJ/kg), as is the stoichiometric AFR of the two fuels (between about 14.5-14.7:1).

Although the friction mean effective pressure (FMEP) of a Diesel engine will be higher to that of a gasoline engine of similar layout, technology and displacement, for the purposes of a rough estimation which this is (this is by no means an industrial-grade analysis), it would suffice to assume them roughly equal. This assumption is valid in spite of the fact that although FMEP would be higher at a given RPM, maximum power of a Diesel engine occurs at a lower RPM than a gasoline engine (4000 RPM vs. 5500 RPM or more). FMEP increases with RPM, but since we're interested in ONE operating point, that is at maximum power, the blunt assumption is sufficient.

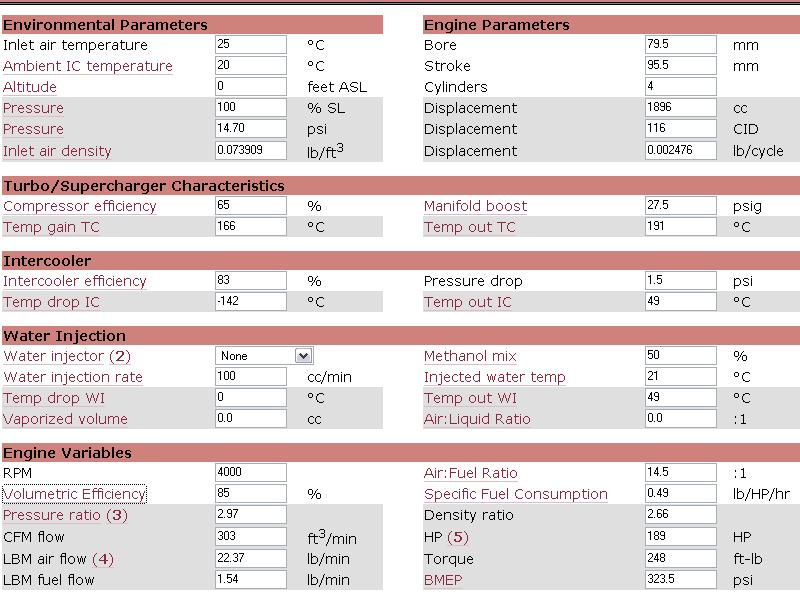
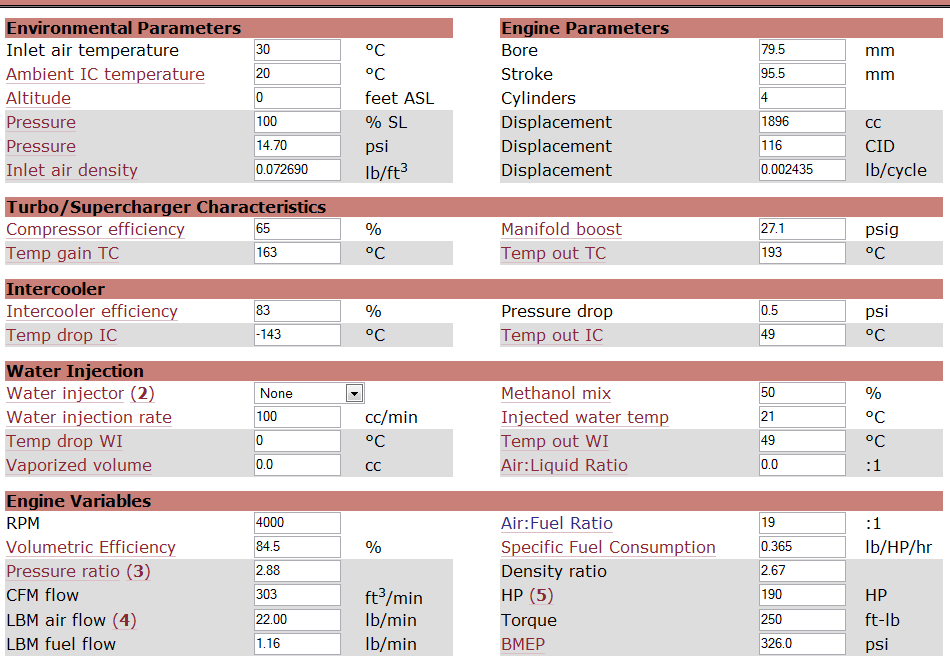
Screenshot of the calculation results:


For your enjoyment to play around with the numbers, this link takes you to the Turbo Calculator page with all of the input data from the screenshot above already inserted. (edited Jan. 14,2008: I've updated some of the numbers in the above Hyperlink for even better realism, so some parameters will be slightly changed from the screenshot. For example, an IC pressure loss of only 0.5 PSI is not very realistic)

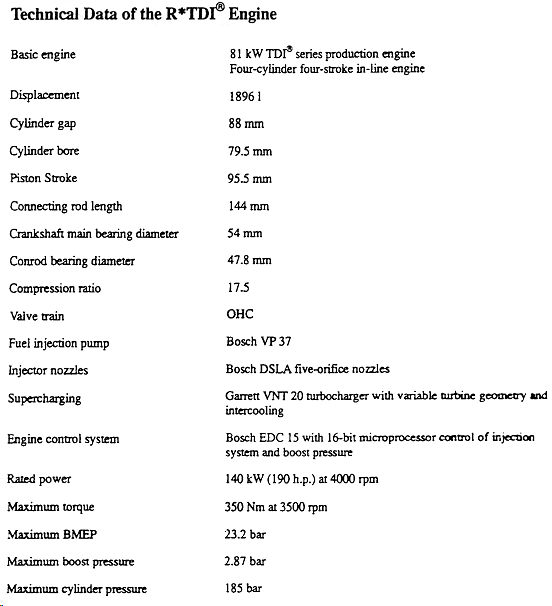
Below is a summary of the technical data of the 1997 R-TDI:


Enjoy!
 
Last edited:
Top